We tracked cleaning costs across 22 sites in seven countries for two years. Manual cleaning runs $1.40-3.80 per kW per wash, water is often the binding constraint rather than labour, and robotic systems only break even above 8 MW in high-soiling zones.
Soiling is the largest recoverable loss on most African solar installations, and it's the one line item that gets left out of financial models almost every time. We've tracked actual cleaning spend across 22 sites in Nigeria, Ghana, Kenya, Tanzania, Uganda, Zambia, and South Africa since 2024. Here's what it really costs.
Manual Cleaning Costs, Measured
Cost per kW per cleaning cycle, all-in (labour, water, transport, supervision):
| Country | Ground mount | Rooftop | Notes |
|---|---|---|---|
| Nigeria | $1.40-1.90 | $2.60-3.80 | Rooftop premium is access and safety kit |
| Ghana | $1.55-2.10 | $2.80-3.60 | |
| Kenya | $1.70-2.30 | $2.90-4.10 | Higher wage floor |
| Tanzania | $1.30-1.75 | $2.40-3.40 | |
| Uganda | $1.25-1.70 | $2.30-3.20 | Cheapest labour in our sample |
| Zambia | $1.45-1.95 | $2.50-3.50 | |
| South Africa | $2.80-3.90 | $4.20-6.10 | Formal labour, compliance costs |
A crew of four cleans 180-260 kW per day on fixed-tilt ground mount with hose access, dropping to 90-140 kW/day on rooftops where they're carrying water and working around safety lines.
South Africa is the outlier because of formal employment costs and working-at-height regulations. Several of our South African clients now use contract cleaning services at $3.10-3.60/kW rather than employing crews directly, which nets out cheaper once you account for compliance overhead.
Water: Usually the Real Constraint
Nobody models this and it stops more cleaning programmes than cost does.
Water consumption per cleaning, measured:
| Method | Litres per kW | Notes |
|---|---|---|
| Hose and brush | 4.2-6.8 | Most common, most wasteful |
| Pressure washer (low pressure, <80 bar) | 2.1-3.4 | Halves consumption |
| Wet brush from tank, no running water | 1.4-2.2 | Best practical option |
| Dry brushing | 0 | See caveat below |
A 1 MW array cleaned by hose consumes 4,200-6,800 litres per wash. In northern Nigeria, northern Kenya, and much of Zambia during dry season, that water has to be trucked in at $8-22 per m³. On a 5 MW site that's $170-750 in water alone per cleaning cycle, sometimes exceeding the labour cost.
Three sites in our sample suspended cleaning entirely during the 2025 dry season because water wasn't available at any price. Their soiling losses hit 19-24% before the rains came.
Practical fix that works: switch to tank-fed wet brushing. Two 200-litre tanks on a wheelbarrow frame, brushes wetted from the tank rather than a running hose. Cuts water use by roughly 65% and, in our measurements, cleans just as well. Cost to set up: under $400 per crew.
Dry Brushing: Use With Care
Dry brushing uses no water and is tempting in arid regions. We tested it at two Nigerian sites over 11 months.
Cleaning effectiveness was acceptable — recovered 82-89% of soiling loss versus 96-99% for wet cleaning. The problem showed up in month 8.
Microscope inspection of dry-brushed glass showed fine abrasion patterns on both the standard AR coating and the anti-glare surface. Measured transmission loss on the abraded samples: 0.6-1.1% versus unbrushed reference glass.
That's permanent. Recovering 85% of a 14% soiling loss while permanently sacrificing 0.9% of transmission is a bad trade if you do it repeatedly.
Where dry brushing is defensible: loose dust only, soft brush, no more than 3-4 times per year, and only when water genuinely isn't available. Never on cemented soiling or bird droppings — you'll grind it into the glass.
Optimal Cleaning Frequency
This is the calculation most operators get wrong in both directions. Some clean monthly out of caution and waste money; others never clean and lose 20% of generation.
The optimum is where marginal recovered revenue equals marginal cleaning cost.
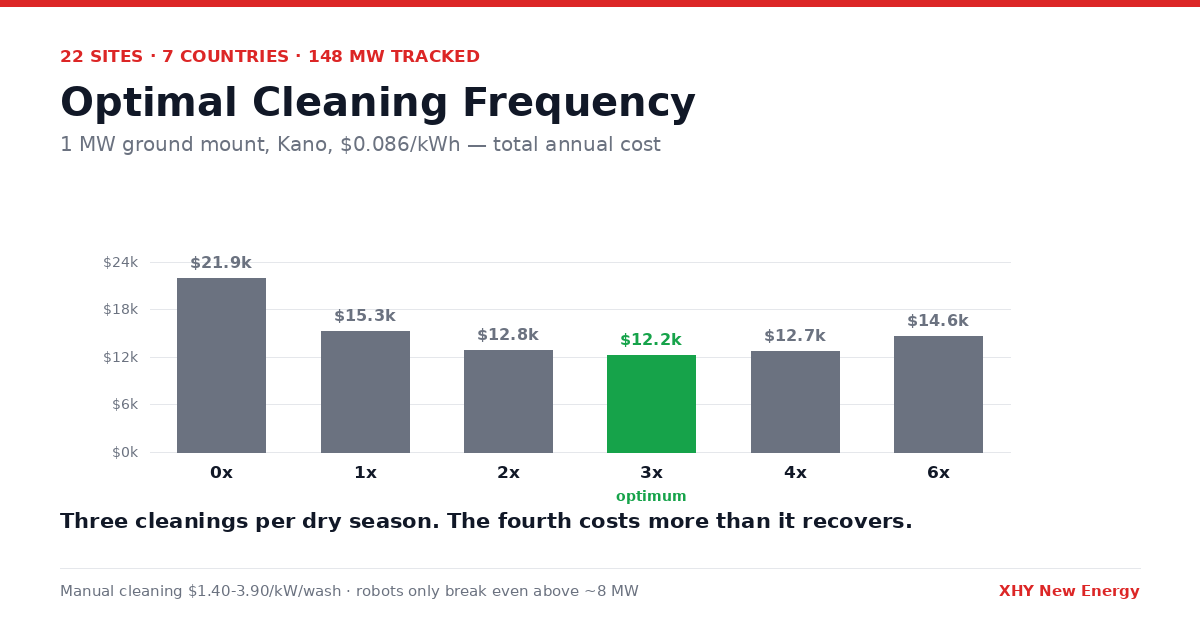
Worked example: 1 MW ground mount, Kano, standard AR glass, $0.086/kWh, 1,720 kWh/kWp/year
Soiling accumulation in dry season, roughly 2.6 percentage points per month for the first four months, then flattening.
| Cleanings per dry season (7 months) | Average soiling loss | Annual generation lost | Revenue lost | Cleaning cost | Total cost |
|---|---|---|---|---|---|
| 0 | 14.8% | 254,560 kWh | $21,892 | $0 | $21,892 |
| 1 | 9.2% | 158,240 kWh | $13,609 | $1,650 | $15,259 |
| 2 | 6.4% | 110,080 kWh | $9,467 | $3,300 | $12,767 |
| 3 | 4.9% | 84,280 kWh | $7,248 | $4,950 | $12,198 |
| 4 | 4.1% | 70,520 kWh | $6,065 | $6,600 | $12,665 |
| 6 | 3.2% | 55,040 kWh | $4,733 | $9,900 | $14,633 |
Optimum is three cleanings per dry season. Going from three to four costs more than it recovers. Going from zero to three saves $9,694/year on a 1 MW site.
Run this same table for your own site — the inputs that move the answer most are soiling rate and tariff, not labour cost.
Rough guidance from our 22 sites:
| Site type | Cleanings per year |
|---|---|
| Sahel, long dry season, standard glass | 4-5 |
| Sahel, anti-dust coated | 2-3 |
| Equatorial, two wet seasons | 2 |
| Coastal, salt film | 3-4 |
| Near unpaved road or quarry | 6-9 |
| Near cement plant or mining operation | Monthly, and reconsider the site |
Robotic Cleaning: The Honest Break-Even
Robotic systems get pitched hard at African utility projects. We've evaluated three deployments and modelled several more.
Capital cost: $14,000-26,000 per MW for rail-guided systems, plus racking modification. Semi-autonomous units that a technician moves between rows run $8,000-15,000 per MW.
Operating cost: $2,800-4,200 per MW per year (power, maintenance, technician time, spare parts).
Break-even against manual cleaning at four cycles per year:
Manual: 4 × $1,650 = $6,600 per MW per year Robotic: $3,500/year operating + capital amortised over 10 years at 8% ($20,000 → $2,980/year) = $6,480 per MW per year
Essentially break-even at 1 MW. So why bother?
Two real advantages that don't show in that comparison:
-
Robots clean more often for the same cost. At 12-24 cycles per year, average soiling loss drops to 1.5-2.2% versus 4.9% at three manual cleanings. On a 10 MW site at $0.086/kWh that's roughly $47,000/year of additional generation.
-
Water. Dry-brush robots with microfibre heads use zero water. At sites where water costs $18-22/m³, that alone justifies the system.
Where robots genuinely pay: above roughly 8 MW, in high-soiling zones, where water is expensive or unavailable, and where the racking was designed for robot rails from the start. Retrofitting rails onto an existing array costs $9,000-16,000/MW and usually kills the business case.
Where they don't: rooftops (geometry rarely suits them), sites under 5 MW, anywhere with two wet seasons doing natural cleaning, and any site where you can't keep a trained technician on staff. We've seen two robotic systems sitting idle in Ghana because the maintenance contract lapsed and nobody locally could service them.
Cleaning Method and Water Quality
Water quality matters more than people expect, particularly in borehole-fed regions.
We measured post-cleaning residual loss by water hardness:
| Water source | Hardness (mg/L CaCO₃) | Residual loss after drying |
|---|---|---|
| Deionized | <10 | 0.2% |
| Municipal (Nairobi) | 90-140 | 0.5% |
| Borehole (Kano) | 320-480 | 1.8% |
| Borehole (Tanzania, one site) | 610 | 3.1% |
Hard water leaves mineral deposits that don't wash off with the next cleaning. At the 610 mg/L site, four cleanings in a year left a cumulative haze costing 2.4% output that only came off with an acid wash.
If your water is above roughly 250 mg/L hardness, either squeegee dry after washing or fit an inline softener. A basic softener cartridge system costs $600-1,400 and pays back quickly on any site above 500 kW.
Also: never clean in the middle of the day. Cold water on 65°C glass risks thermal shock, and rapid evaporation guarantees mineral spotting. Clean before 09:00 or after 17:00. Every site in our sample that ignored this ended up with visible spotting.
What to Put in Your O&M Budget
Realistic annual O&M for African solar, per MW:
| Line item | Ground mount | Rooftop |
|---|---|---|
| Cleaning (3-4 cycles) | $4,950-6,600 | $8,400-13,300 |
| Water | $400-2,200 | $300-1,600 |
| Inverter maintenance | $1,800-2,600 | $1,600-2,400 |
| Vegetation control | $900-1,600 | $0 |
| Security | $2,400-6,000 | $0-1,200 |
| Monitoring and reporting | $600-1,100 | $600-1,100 |
| Spares reserve | $1,200-1,800 | $1,000-1,600 |
| Total | $12,250-21,900 | $11,900-21,200 |
Most financial models we're asked to review budget $8,000-10,000/MW/year. That's low by 30-50% for African conditions, and cleaning is where the gap usually sits.
Method Notes
- 22 sites, 7 countries, 148 MW combined, tracked January 2024 - July 2026
- Soiling loss measured against a reference module cleaned before each reading, per IEC 61724-1
- Cleaning costs from actual invoices and payroll records, converted at period-average FX
- Water consumption metered at three sites, estimated from tank refills at the rest
- Glass abrasion assessed by optical microscopy at 200×, transmission measured with an integrating sphere on 50×50mm coupons cut from decommissioned modules
Planning O&M for a new project and want realistic numbers? Send me your site location and array design — I'll give you a cleaning schedule and budget based on comparable sites we track. Jack Chen | ivy@longijinko.com | WhatsApp +86 189 0619 0578
Have Questions About This Article?
Our technical team is here to help you choose the right solar solution for your project.